FPL Predicted Points Explained: Limits and Uses

The highest predicted scorer isn't automatically your best captain or transfer target, because published forecast testing shows that accuracy can deteriorate among the players managers are most likely to choose.
Use FPL predicted points to build a shortlist, then let minutes certainty, price and fixtures decide close calls.
What a Predicted Points Figure Tells You
A predicted points figure is a conditional planning aid, useful for identifying plausible picks but less convincing as a precise ordering of closely matched options.
It estimates fantasy output over a specified upcoming gameweek by combining possible appearances, attacking returns, clean sheets, saves, bonus and deductions.
Say you're comparing midfielders with the same projected total, but one has a secure starting role while the other faces a late fitness assessment and competition for his place.
Equal totals can conceal different risks
The figures aren't equally actionable unless the forecasts make comparable assumptions about involvement.
The secure starter offers a clearer route to appearance points and sustained attacking opportunity, while the doubtful player could spend much of the match on the bench.
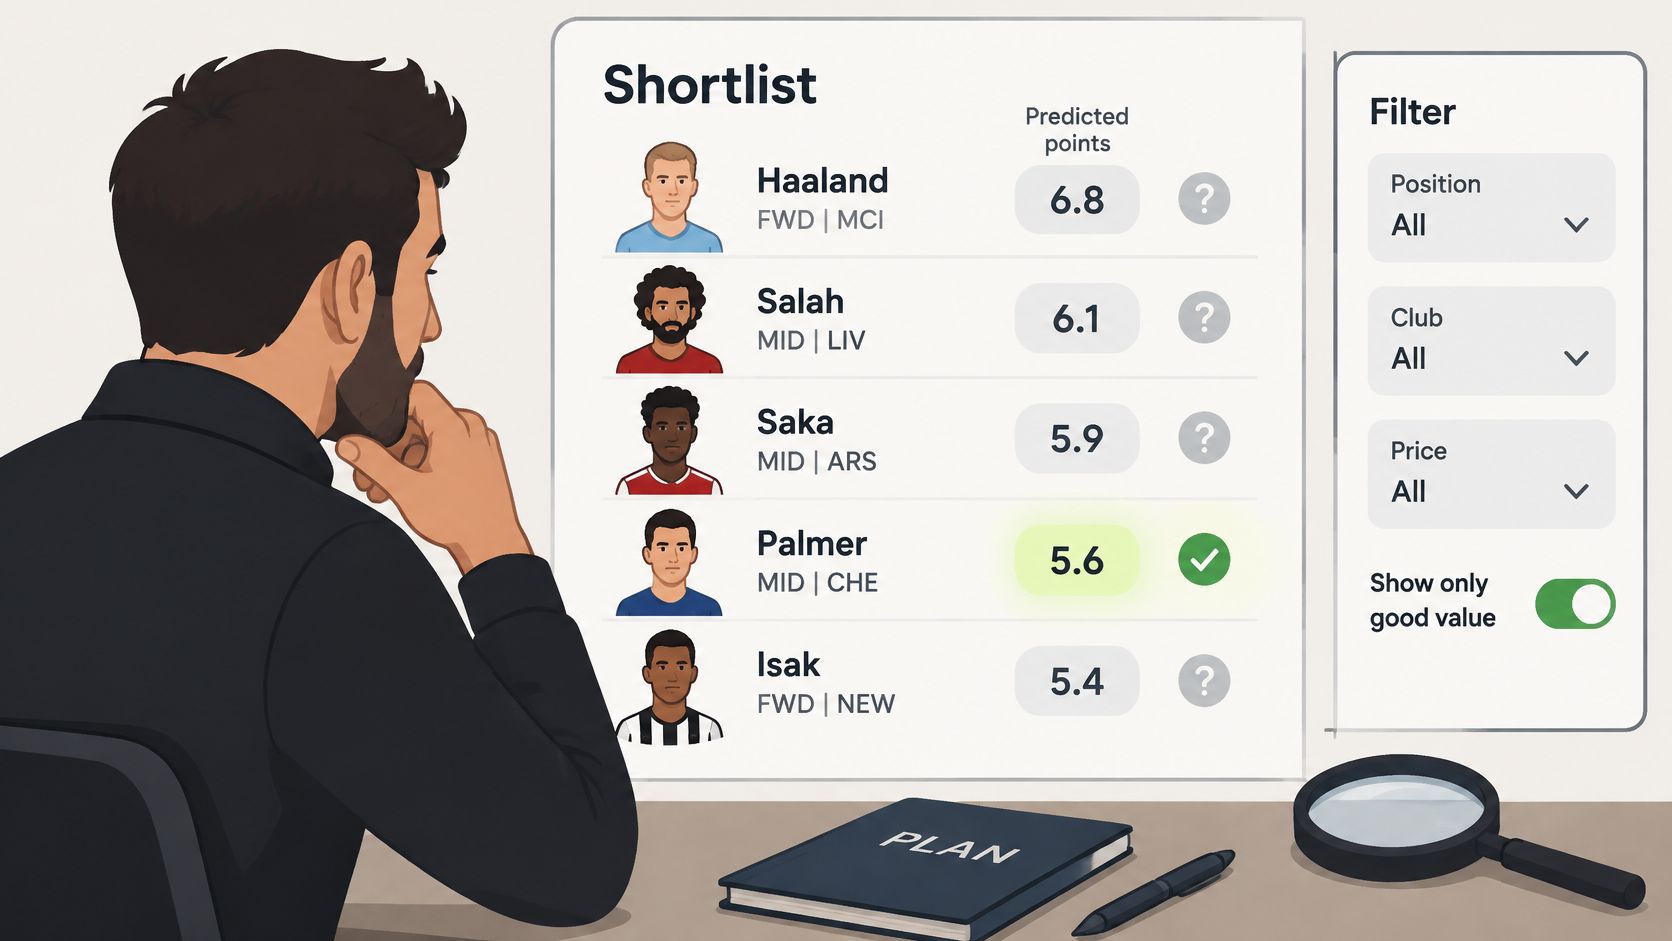
Illustration of shortlist analysis, not a verified player-stat screenshot.
Before acting, establish what the model assumes rather than treating its output as a promise.
Scoring: Which routes to points explain the projection?
Uncertainty: Does the estimate already account for injury, rotation and substitutions?
Decision: Is the advantage meaningful after affordability and transfer costs?
A useful forecast supports a decision you can explain in football terms.
If your entire argument rests on a slightly larger decimal, you haven't established why the player is the better choice.
How Scoring Rules Build the Estimate
The official FPL scoring rules award goals 10 points for goalkeepers, 6 for defenders, 5 for midfielders and 4 for forwards, with 3 points for an assist across positions.
The same rules award clean-sheet points as follows.
Position | Goal | Assist | Clean sheet |
|---|---|---|---|
Goalkeeper | 10 | 3 | 4 |
Defender | 6 | 3 | 4 |
Midfielder | 5 | 3 | 1 |
Forward | 4 | 3 | Not stated in the cited extract |
These positional differences mean identical attacking opportunities don't necessarily produce identical expected fantasy returns.
A model must translate football events into the scoring rules for the player's registered FPL position.
Start with minutes and eligibility
The appearance rules award 1 point for playing fewer than 60 minutes and 2 points for reaching at least 60 minutes, excluding stoppage time.
For a defender, the projection must also account for clean-sheet eligibility, the probability of conceding, attacking involvement and defensive-contribution thresholds.
A likely early substitution therefore affects more than the time available to score or assist.
The model also needs disciplinary and other downside assumptions: minus 1 for a yellow card, minus 2 for a missed penalty, minus 3 for a red card, and minus 1 for every two goals conceded by a goalkeeper or defender.
Saves, penalty saves and defensive contributions provide additional routes to points rather than just increasing an attacking forecast.
Separate repeatable opportunities from uncertain rewards
The best performers can receive 1–3 bonus points in each match, but predicting those awards requires estimating how a player will perform relative to everyone else involved.
That makes bonus a further source of uncertainty, not a fixed addition managers should bank.
Practical rule: Identify how a player is expected to earn his points before deciding whether the total looks persuasive.
A midfielder's attacking role may explain much of his appeal, while a defender's estimate can depend more heavily on defensive outcomes.
Compare players with similar roles first, then examine whether a cross-position difference reflects stronger opportunity or merely different scoring mechanisms.
Why Next-Gameweek Figures Stop at One Gameweek
Official expected points cover the next gameweek, not an extended fixture run.
The official FPL player-data endpoint distinguishes output measures such as points per game and form from starts, clean sheets, defensive contributions and current-round or next-round availability.
Those measures answer different questions, so they shouldn't be read as interchangeable evidence of an imminent return.
Check whether availability is already included
For a forecast explicitly conditional on playing, a simplified calculation is expected points if involved multiplied by the probability of involvement.
In an illustrative example involving no real player, halve the conditional projection if the player has an even chance of appearing.
That simplification still doesn't fully describe the difference between starting, making a short substitute appearance and completing most of the match.
Don't apply an availability discount twice if the model has already incorporated it.
Conditional forecast: Adjust the playing assumption before comparing alternatives.
Availability-adjusted forecast: Examine its minutes assumptions rather than mechanically multiplying again.
Unclear methodology: Treat the figure cautiously until its treatment of non-appearance is established.
A chance-of-playing indicator describes availability uncertainty, not a guaranteed start or a promised workload.
Build the longer view separately
For planning beyond the immediate deadline, assess the fixture sequence, expected minutes, tactical role, affordability and likely availability over that separate horizon.
A player can be an attractive immediate selection but an awkward purchase if later fixtures or competition for his position weaken the longer-term case.
Our player prices, points, ownership, form, transfers and expected statistics come from official Fantasy Premier League data.
Editorial verification remains required: the live endpoint hasn't been confirmed for this draft, so exact API field identifiers, current values and refresh timestamps aren't presented as verified.
That distinction matters because completed-match statistics and subsequently refreshed availability information needn't share the same capture time.
Reading Expected Goals Without Treating Them as Points
Chance statistics aren't fantasy points, and strong attacking involvement doesn't establish what a player will return at the next deadline.
The official FPL statistics catalogue includes expected goals, expected assists, expected goal involvements and expected goals conceded alongside other performance measures.
Use those indicators to describe opportunities over a defined completed-match window.
Metric | Measures | Supports | Does not show |
|---|---|---|---|
Total expected goals, xG | Shot chance quality over the selected window | Assessing attacking threat | Actual goals or future conversion |
Total expected assists, xA | Expected creative output for teammates | Assessing creative threat | Assists that will happen |
Expected goal involvement, xGI | xG plus xA | Comparing attacking involvement over the same window | Points, bonus or future minutes |
xGI per 90 | xGI scaled to playing time | Comparing involvement rates | Future playing time or rotation risk |
Expected goals conceded | Quality of chances conceded | Context for clean-sheet potential | Clean sheets directly |
Keep the statistical windows separate
A season total describes accumulated opportunity, while a recent-form sample describes a shorter period that may reflect a changed role or opponent mix.
A per-minute rate helps compare players with different workloads, but it doesn't establish that the player with the stronger rate will receive the greater workload next.
Use the FPL attacking statistics guide when separating shooting threat, creativity and combined attacking involvement.
Season totals: Check how much playing time produced the opportunity.
Recent samples: Establish whether starts, position or set-piece responsibility changed.
Rate comparisons: Keep the denominator and match window consistent.
For defenders, expected goals conceded can contextualise the chances a team allows, but it isn't a direct clean-sheet probability.
Converting historical evidence into a forecast requires assumptions about team strength, opposition, minutes, position, finishing, assists, defensive outcomes, bonus and negative events.
Regression, rolling averages and simulation are methods for making that conversion, not proof that the resulting estimate is an official forecast.
Label every comparison with its season, completed-match window and verification date, rather than combining an older statistical sample with fresh market information without explanation.
Where Predicted Points Are Least Reliable
Only 24% of the top 25 forecasts in a published scorecard finished within two points of their predictions, according to the published forecasting methodology and evaluation.
That scorecard reported mean absolute error of 1.51 points across 659 players, rising to 2.63 among 289 players projected for at least 45 minutes and 3.77 among the top 25 forecasts.
Judge accuracy for the players you actually select
An overall average can conceal weaker precision among likely starters and leading recommendations.
The same methodology reports a separate backtest of 18,126 player-fixture predictions across gameweeks 4–38, using pre-deadline information, with 2.29-point RMSE and 1.40-point MAE, against 2.76 and 1.76 for a hand-built baseline.
Those aggregate improvements don't establish that a small difference between leading picks is dependable.

Conceptual illustration of selection uncertainty, not a forecast-accuracy chart.
A published 2026 replay evaluation reported 1.617 points average prediction error across 456 players, compared with 1.842 for its simple baseline.
A separate published expected-points model statement reported approximately 2.8 points RMSE per player per gameweek in 2026.
These results come from different models, populations and windows, so they aren't a valid league table of forecasting quality.
Use error measures without misreading them
Mean absolute error describes average absolute misses, while RMSE gives greater weight to larger misses.
Neither is automatically a confidence interval for an individual player or a threshold below which every ranking is meaningless.
Small forecast gaps require stronger football evidence, not greater faith in decimal precision.
Use the minutes research resource as part of that assessment, and settle likely workload, price and fixture context before treating closely ranked players differently.
Using Predicted Points for Captaincy and Selection
Choose your captain from credible starters, not just from the first row of a forecast ranking.
Captaincy increases your exposure to the selected player's outcome, so an uncertain starting role deserves particular scrutiny.
A narrow projected lead isn't sufficient compensation for a substantially less secure workload.
Test the attacking route against the fixture
The Premier League's explanation of FPL changes describes Fixture Difficulty Rating on a 1-to-5 scale, with 1 easiest and 5 hardest.
Use that rating as context rather than a substitute for analysing the player's role.
Opponent and venue: Confirm the actual fixture and whether the player is home or away.
Attacking responsibility: Establish whether the player leads the attack, creates chances or operates deeper.
Workload: Assess the likelihood of a start and an early substitution.
Alternative: Check whether another captain candidate offers a comparable attacking route with less uncertainty.
Say a forward leads the projections but remains a fitness doubt, while a midfielder sits slightly behind and has substantially clearer starting prospects.
If their attacking opportunities are otherwise comparable, I'd favour the midfielder rather than pay for uncertainty through the armband.
Distinguish safety from ceiling
A secure attacker with credible goal and assist involvement can justify accepting a difficult fixture.
A defender whose estimate relies mainly on a clean sheet offers a different risk profile, particularly when conceding would remove the central reason for selecting him.
For starting-line-up decisions, apply the same role analysis without assuming that every defender is defensive or every midfielder attacks.
Record the target gameweek and capture time, then reassess the captain and alternative after the latest official team news available before the deadline.
Turning a Forecast Into a Transfer Decision
The official FPL transfer rules provide one free transfer per gameweek after the first deadline, with a four-point deduction for each additional transfer beyond your available free transfers.
A positive projected improvement isn't enough when the move also creates a points cost.
The following comparison assumes you begin with only the newly awarded free transfer available, rather than additional banked transfers.
Transfer in the same gameweek | Cumulative points deducted | Expected gain needed |
|---|---|---|
First transfer, free transfer available | 0 | An improvement worth using the transfer |
Second transfer | 4 | More than 4 points across the moves |
Third transfer | 8 | More than 8 points across the moves |
Fourth transfer | 12 | More than 12 points across the moves |
Buying and holding require different comparisons
For a prospective purchase, compare the target with realistic alternatives that fit the same squad need.
For an owned player, compare keeping him with the complete cost of replacing him, including lost flexibility and the possibility of wanting him back.
Holding a likely starter can be preferable when the projected improvement is small and no urgent squad problem needs solving.
The rules also set a £100.0m initial squad budget, so affordability must be assessed across the squad rather than by comparing headline player prices alone.
Money committed to a marginal upgrade can't simultaneously solve a more serious weakness elsewhere.
Evaluate the move as a package
A useful parallel is Zemith's discussion of data-driven business strategy choices, because a numerical estimate supports a decision only when its assumptions and practical costs are considered together.
In FPL terms, compare the full outcome of the proposed moves with the outcome of doing nothing.
Immediate improvement: Does the likely gain exceed the cost?
Squad consequences: Does the move weaken the bench or block a higher-priority purchase?
Availability problem: Are you replacing a genuine non-starter rather than chasing a marginal upgrade?
Planning horizon: Is the longer-term case supported by a separate fixture assessment?
A serious injury, confirmed suspension or sustained loss of minutes changes the comparison because the alternative may be a weak substitute.
It doesn't make the deduction disappear.
Use the FPL transfer decision guide to structure the buy-versus-hold comparison, while recognising that no forecast removes uncertainty about substitutions, future selection or price changes.
Confirm the Forecast Before Your Next Transfer
Confirm the player and the assumptions before confirming the transfer.
This is an evergreen explanation, not a verified live recommendation for a particular deadline.
Editorial verification fields
Season: 2026/27.
Target gameweek: [Editor to confirm against current official FPL fixtures].
Data capture date and time: [Editor to enter after verification].
Completed-match statistical window: [Editor to confirm season and included gameweeks].
Deadline: [Editor to verify against official FPL].
No current player price, club, availability update or fixture-specific recommendation is asserted without that check.
Pre-deadline checklist
Identity and affordability: Confirm the player's current club, FPL position and price.
Availability: Check the official flag and relevant club reporting without equating availability with a start.
Role: Compare expected workload and tactical responsibility.
Fixtures: Examine the target gameweek and subsequent fixtures separately.
Transfer position: Count available free transfers and the resulting deduction.
Downside: Reassess the move with reduced minutes.
Record: Save the gameweek, capture time and statistical window used.
Buy when the realistic improvement justifies the move; hold when the advantage is marginal and your owned player remains a credible starter.
Our next-gameweek xP is supplied by FPL and used unchanged, whereas TFA projections are estimates, not official FPL forecasts.
Public player profiles can support your checks, but additional tool and access claims require verification before publication.
Before your next deadline, build an affordable shortlist in FPL Player Stats, check each candidate's minutes and role against official team news, and write down why buying beats holding before you make the transfer.